What Is Your Job Actually Worth in Singapore?
Singapore's Ministry of Manpower publishes real wage data for every occupation — P25, P50, P75. Here's how to read those numbers and use them to negotiate your next offer with confidence, not guesswork.
What Is Your Job Actually Worth in Singapore?
How to Read the Numbers and Use Them
Earlier this year, an NUS grad built a free tool called Lowball after getting a job offer thousands below his course median —using salary data scraped from job listings. It went viral, because being underpaid without realising it is a problem almost every jobseeker in Singapore has felt.
That problem does not disappear once you have fifteen years of experience. It gets more expensive. You have been offered $7,500 a month. Is that fair?
Most mid-career professionals cannot answer that question with confidence. They compare it to their last salary, guess based on what a friend earns, or accept because the number feels reasonable. None of those methods are reliable —and for experienced professionals, the cost of getting it wrong compounds over years, not just one offer.
Singapore’s Ministry of Manpower publishes the real answer: actual wage data, by occupation, drawn from what people are really paid —not what a job ad advertises. TalentReady turns that data into a benchmark shown directly on your dashboard, so you are not left digging through government statistics alone. This article explains how to read the numbers —and how to use them in a real salary conversation.
The three numbers: P25, P50, and P75
MOM’s Occupational Wage Statistics (OWS) breaks salaries into three percentiles for every occupation:
P25 —25% of people in this role earn below this figure.
P50 (median) —half earn below, half earn above. The true market midpoint, not skewed by outliers the way an average is.
P75 —25% of people in this role earn above this figure —roughly the top quarter of the market.
Together, they give you a range, not a single number —so you can place any offer in context.
A concrete example: Finance Manager
Based on MOM’s Occupational Wage Statistics 2024 (covering 2023 wage data), a Finance Manager in Singapore sits roughly in this range (gross monthly wage, including employer CPF):
P25 ~$6,500/month
P50 ~$9,200/month (market midpoint)
P75 ~$13,500/month
Source: Ministry of Manpower Singapore, Occupational Wage Statistics 2024 (2024, covering 2023 wage data). Figures are approximate —verify against the latest edition at mom.gov.sg/statistics.
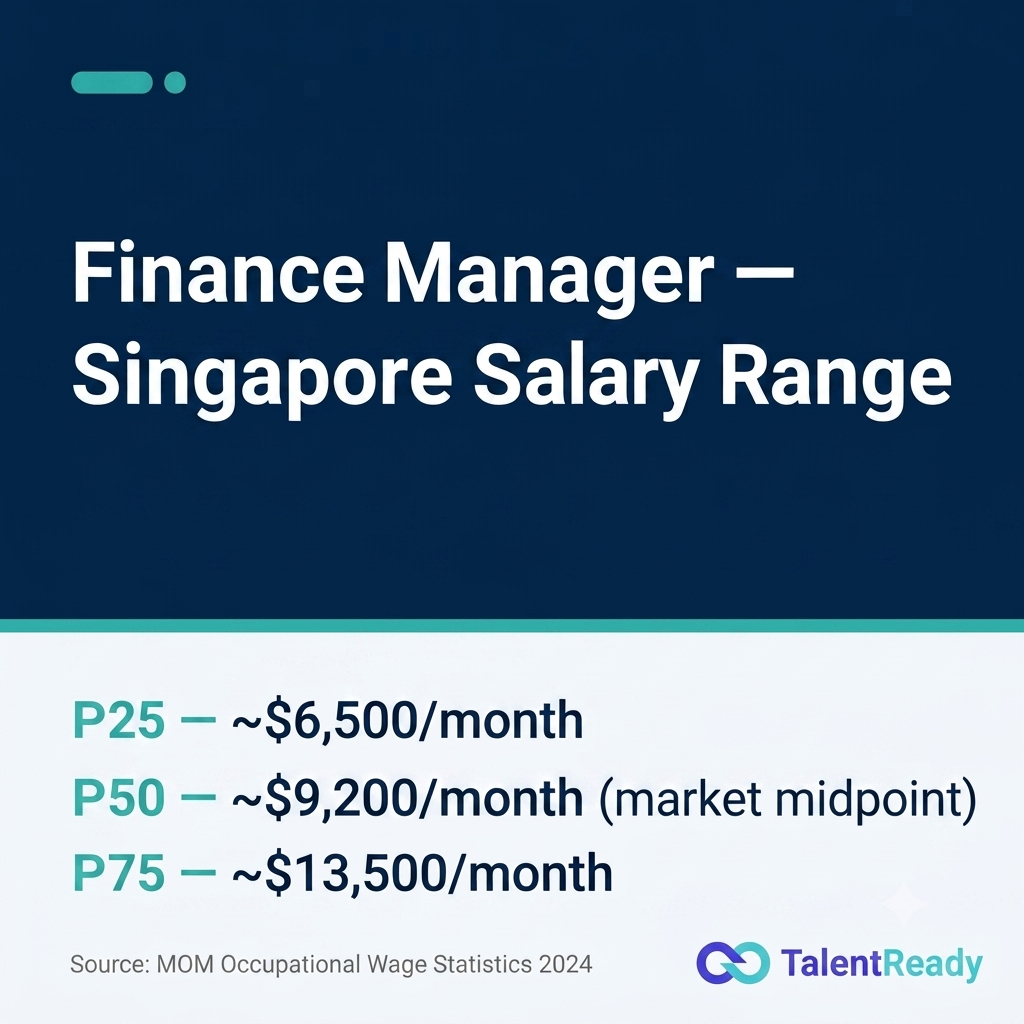
This spread is significant. An offer of $7,000 sits in the lower quarter of the market. An offer of $11,000 is comfortably above median but not yet top quartile. Neither number means anything on its own —only against the range.
Why mid-career professionals often get this wrong
Anchoring to the last salary. If you earned $7,200 in your previous role and a new offer comes in at $7,500, it feels like a raise. It may still be below P50 for the role you are stepping into. Your last salary is not a market data point —it is what one employer paid you in a different context.
Fear of losing the offer. After a retrenchment or an extended job search, the instinct is to accept before the offer disappears. This is understandable. It is also the single most expensive financial decision most people make during a job search. Employers expect negotiation —particularly at the senior level.
Not knowing where the ceiling is. If you do not know that P75 for your role is $13,500, you cannot aim for it. Most people negotiate within a narrow band around the offer figure, not realising the ceiling is significantly higher.
Relying on advertised job ranges. Tools built on job listings —like Lowball, which benchmarks against MyCareersFuture postings —are genuinely useful for calibrating early-career offers, where the posted range often is the negotiation range. At the senior level this breaks down. Roles filled through direct outreach or referral are rarely advertised at all, and the range on a listing is frequently the floor a company is willing to offer, not the ceiling a strong candidate can command. A number scraped from a job ad tells you what was advertised. It does not tell you what was actually paid.
How to use this data in a real conversation
Once you know your P50 and P75, the conversation becomes straightforward.
If the offer is below P50:
"I have looked at MOM’s occupational wage data for this role. The median for a Finance Manager in Singapore is around $9,200. Based on my [X years of experience / specific track record], I was expecting to be at or above that. Is there flexibility to get closer to $9,000?"
If the offer is between P50 and P75:
"The offer is fair relative to the market median. Given my [specific experience element], I would like to explore whether there is room to move to [P75-adjacent figure]. Is that a conversation worth having?"
Two rules for this conversation: cite the source (MOM, not “I heard” or “I think”), and anchor to your specific experience —not just tenure. Years of experience is a weak negotiating variable. What you have delivered, the scale of what you have managed, and what you are bringing to this role specifically —those are strong ones.
Finding your number
MOM’s Occupational Wage Statistics covers over 300 occupations and is updated annually each June. Unlike tools built on job listings, this dataset reflects wages actually paid across the workforce —drawn from employer wage surveys, not job ad copy written to attract applicants. The most recent edition at time of writing is OWS 2024 (2023 data). You can find all editions at mom.gov.sg/statistics under “Occupational Wage Statistics”.
The challenge is that MOM’s report uses standardised occupational categories, which may not map cleanly to your actual job title. A “Senior Business Development Manager” might sit across three different MOM categories depending on how the company defines the role.
The TalentReady salary benchmarking tool solves this: it maps your profile and target role against live Singapore market data and shows your P25/P50/P75 range directly on your dashboard. No manual cross-referencing needed.
If you are a professional on TalentReady, your salary benchmark is already calculated —look for the salary range indicator on your profile page.
If you are not yet on the platform, you can sign up free at talentready.sg and see your benchmark within minutes of completing your profile.
The number is not the ceiling
Knowing your P50 tells you where the market sits. It does not tell you where you should sit. For mid-career professionals with genuine depth —cross-functional leadership, P&L accountability, the ability to walk into a role and deliver from day one —the P75 is often the more honest benchmark.
The question worth asking before any salary conversation is not “what will they accept?” It is: “what is a senior hire with my track record actually worth to this company?”
Answer that first. Then negotiate from there.
TalentReady is Singapore’s AI job matching platform built for mid-career professionals. Sign up free at talentready.sg.
References
Ministry of Manpower Singapore. (2024). Occupational Wage Statistics 2024 (2023 wage data). mom.gov.sg/statistics
Ministry of Manpower Singapore. (2026, April). Labour Market Report Q1 2026. mom.gov.sg/statistics
Ministry of Manpower Singapore. (n.d.). Fair Consideration Framework. mom.gov.sg/employment-practices/fair-and-progressive-practices
The Straits Times. (2026). Think you’ve been “lowballed”? This National University of Singapore grad built a tool that lets you compare salary offers. straitstimes.com
Note. Salary percentiles for the Finance Manager example are drawn from MOM’s Occupational Wage Statistics 2024 and reflect 2023 wage data. Readers are advised to verify figures against the latest available edition, published annually each June.